Got contracts to review? While you're here for proposals, let Cobrief make contract review effortless—start your free review now.
Customize this template for free
Customize this free financial KPI dashboard proposal with Cobrief
Open this free financial KPI dashboard proposal in Cobrief and start editing it instantly using AI. You can adjust the tone, structure, and content based on the client’s business model, reporting cadence, and tech stack. You can also use AI to review your draft — spot gaps, tighten language, and improve clarity before sending.
Once you're done, send, download, or save the proposal in one click — no formatting or setup required.
This template is fully customizable and built for real-world use — ideal for pitching dashboard builds to CFOs, operators, or startup founders who want real-time visibility into financial performance. Whether you’re building from scratch or optimizing existing reports, this version gives you a structured head start and removes the guesswork.
What is a financial KPI dashboard proposal?
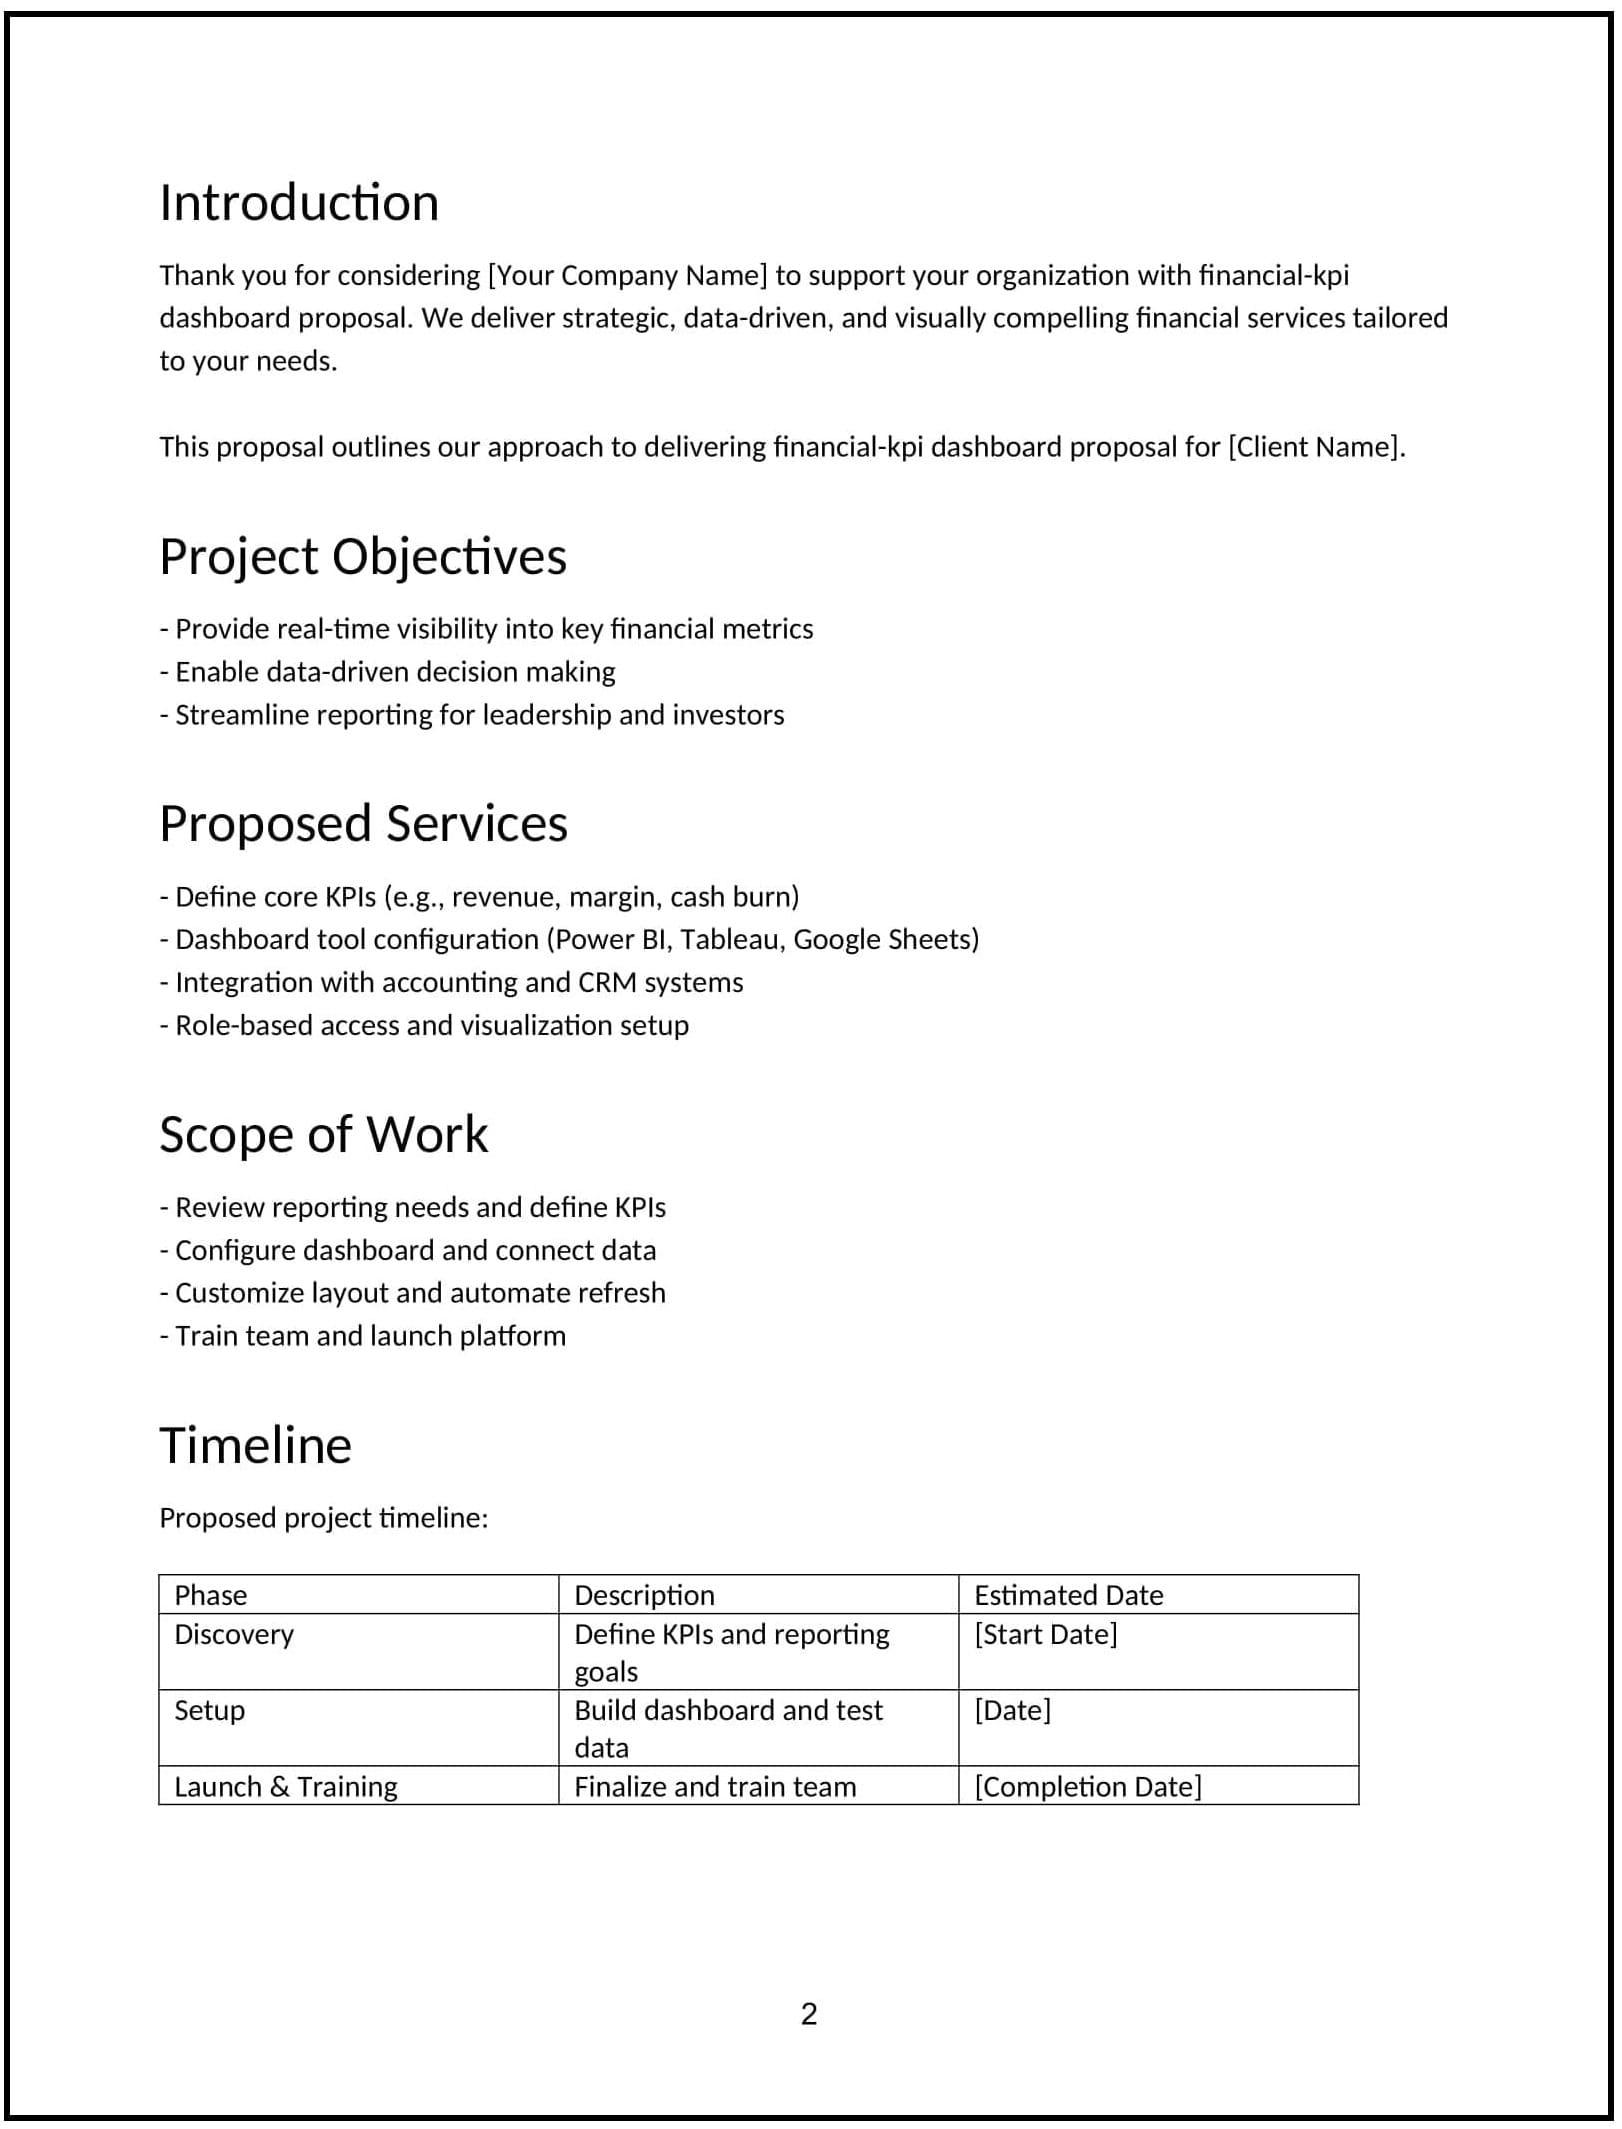
A financial KPI dashboard proposal outlines your plan to build or improve a centralized dashboard that tracks a company’s core financial metrics. It typically includes KPI selection, data integration, visualization design, platform setup, and reporting workflows.
This type of proposal is commonly used:
- When a company is growing and leadership needs better financial visibility
- To replace manual reporting with real-time, automated dashboards
- Ahead of board meetings, fundraising, or internal forecasting cycles
- When finance, sales, and ops are disconnected on performance metrics
It helps clients stay aligned on what matters, make faster decisions, and catch problems before they escalate.
A strong proposal helps you:
- Align stakeholders on which KPIs matter and how they’re defined
- Connect data sources (e.g., QuickBooks, Stripe, HubSpot, Google Sheets) to a single reporting layer
- Design dashboards that are readable, focused, and tailored to the audience
- Set up recurring reporting flows — weekly, monthly, or board-ready
Why use Cobrief to edit your proposal
Cobrief helps you build a sharp, clean proposal fast — with smart structuring and in-browser AI support.
- Edit the proposal directly in your browser: Skip file juggling — just open, write, and finalize in one place.
- Rewrite sections with AI: Tailor the tone instantly for CFOs, startup founders, or fractional finance teams.
- Run a one-click AI review: Let AI catch unclear scope items, jargon-heavy phrasing, or missed deliverables.
- Apply AI suggestions instantly: Accept edits line by line or apply improvements across the whole draft.
- Share or export instantly: Send the proposal via Cobrief or download a clean PDF or DOCX version.
You’ll get from draft to delivery-ready in minutes — without any formatting lag.
When to use this proposal
Use this financial KPI dashboard proposal when:
- A client wants to track key metrics like MRR, burn, CAC, runway, and margins in real time
- You’re helping replace ad hoc Excel files or disconnected reports with a single source of truth
- The company is raising capital and needs board-quality financial visibility
- Finance, sales, and ops teams are out of sync on goals and performance
- There’s a push to automate manual reporting ahead of scale or audits
It’s especially useful when the team is growing and leadership wants cleaner data and tighter controls.
What to include in a financial-KPI dashboard proposal
Use this template to walk the client through your dashboarding approach — from KPI mapping to delivery — in clear, business-focused language.
- Project overview: Frame the problem — messy reports, slow access, unclear metrics — and how your dashboard will solve it.
- KPI scoping: Define which metrics are in scope — revenue, churn, gross margin, runway, cash burn, CAC, LTV, etc. Tailor this by client type (e.g., SaaS, eCom, services).
- Data sources: Clarify what systems you’ll connect — e.g., QuickBooks, Xero, Stripe, Salesforce, Google Sheets, or payroll tools.
- Tool selection: State whether you’re using Google Data Studio, Looker Studio, Tableau, Power BI, or a custom-built Notion/Airtable/GSheets flow.
- Dashboard structure: Explain how dashboards will be grouped (e.g., Exec summary, Finance deep dive, Team-level metrics), and how filters or time views will work.
- Design and usability: Describe your design approach — clear layout, consistent formatting, role-based visibility (e.g., board vs. team dashboards).
- Reporting workflows: Define how often data will update, who owns it, and how outputs will be used (e.g., board prep, monthly review, investor updates).
- Implementation process: Break into phases — scoping, setup, build, test, iterate, handoff — with estimated timelines.
- Pricing: Offer a flat fee for setup, optional recurring reporting support, or tiers based on feature depth (e.g., core dashboard vs. advanced metrics).
- Next steps: End with a clear CTA — like reviewing KPIs, connecting sample data, or booking the kickoff session.
How to write an effective financial KPI dashboard proposal
This proposal should feel structured, results-driven, and pragmatic — especially for founders and CFOs focused on speed, clarity, and ROI.
- Anchor in business outcomes: Don’t just say “build dashboard” — say “help execs make faster, clearer decisions.”
- Avoid bloat: Clients want just enough metrics — not 100 charts they’ll never look at.
- Set up handoff early: Clarify who maintains the dashboard, updates source data, and handles edge cases post-build.
- Tailor KPIs by business model: A SaaS dashboard shouldn’t look like a DTC one. Use language that matches their operations.
- Flag optional add-ons: Recurring reporting, investor updates, and cohort analysis can all be sold separately.
Frequently asked questions (FAQs)
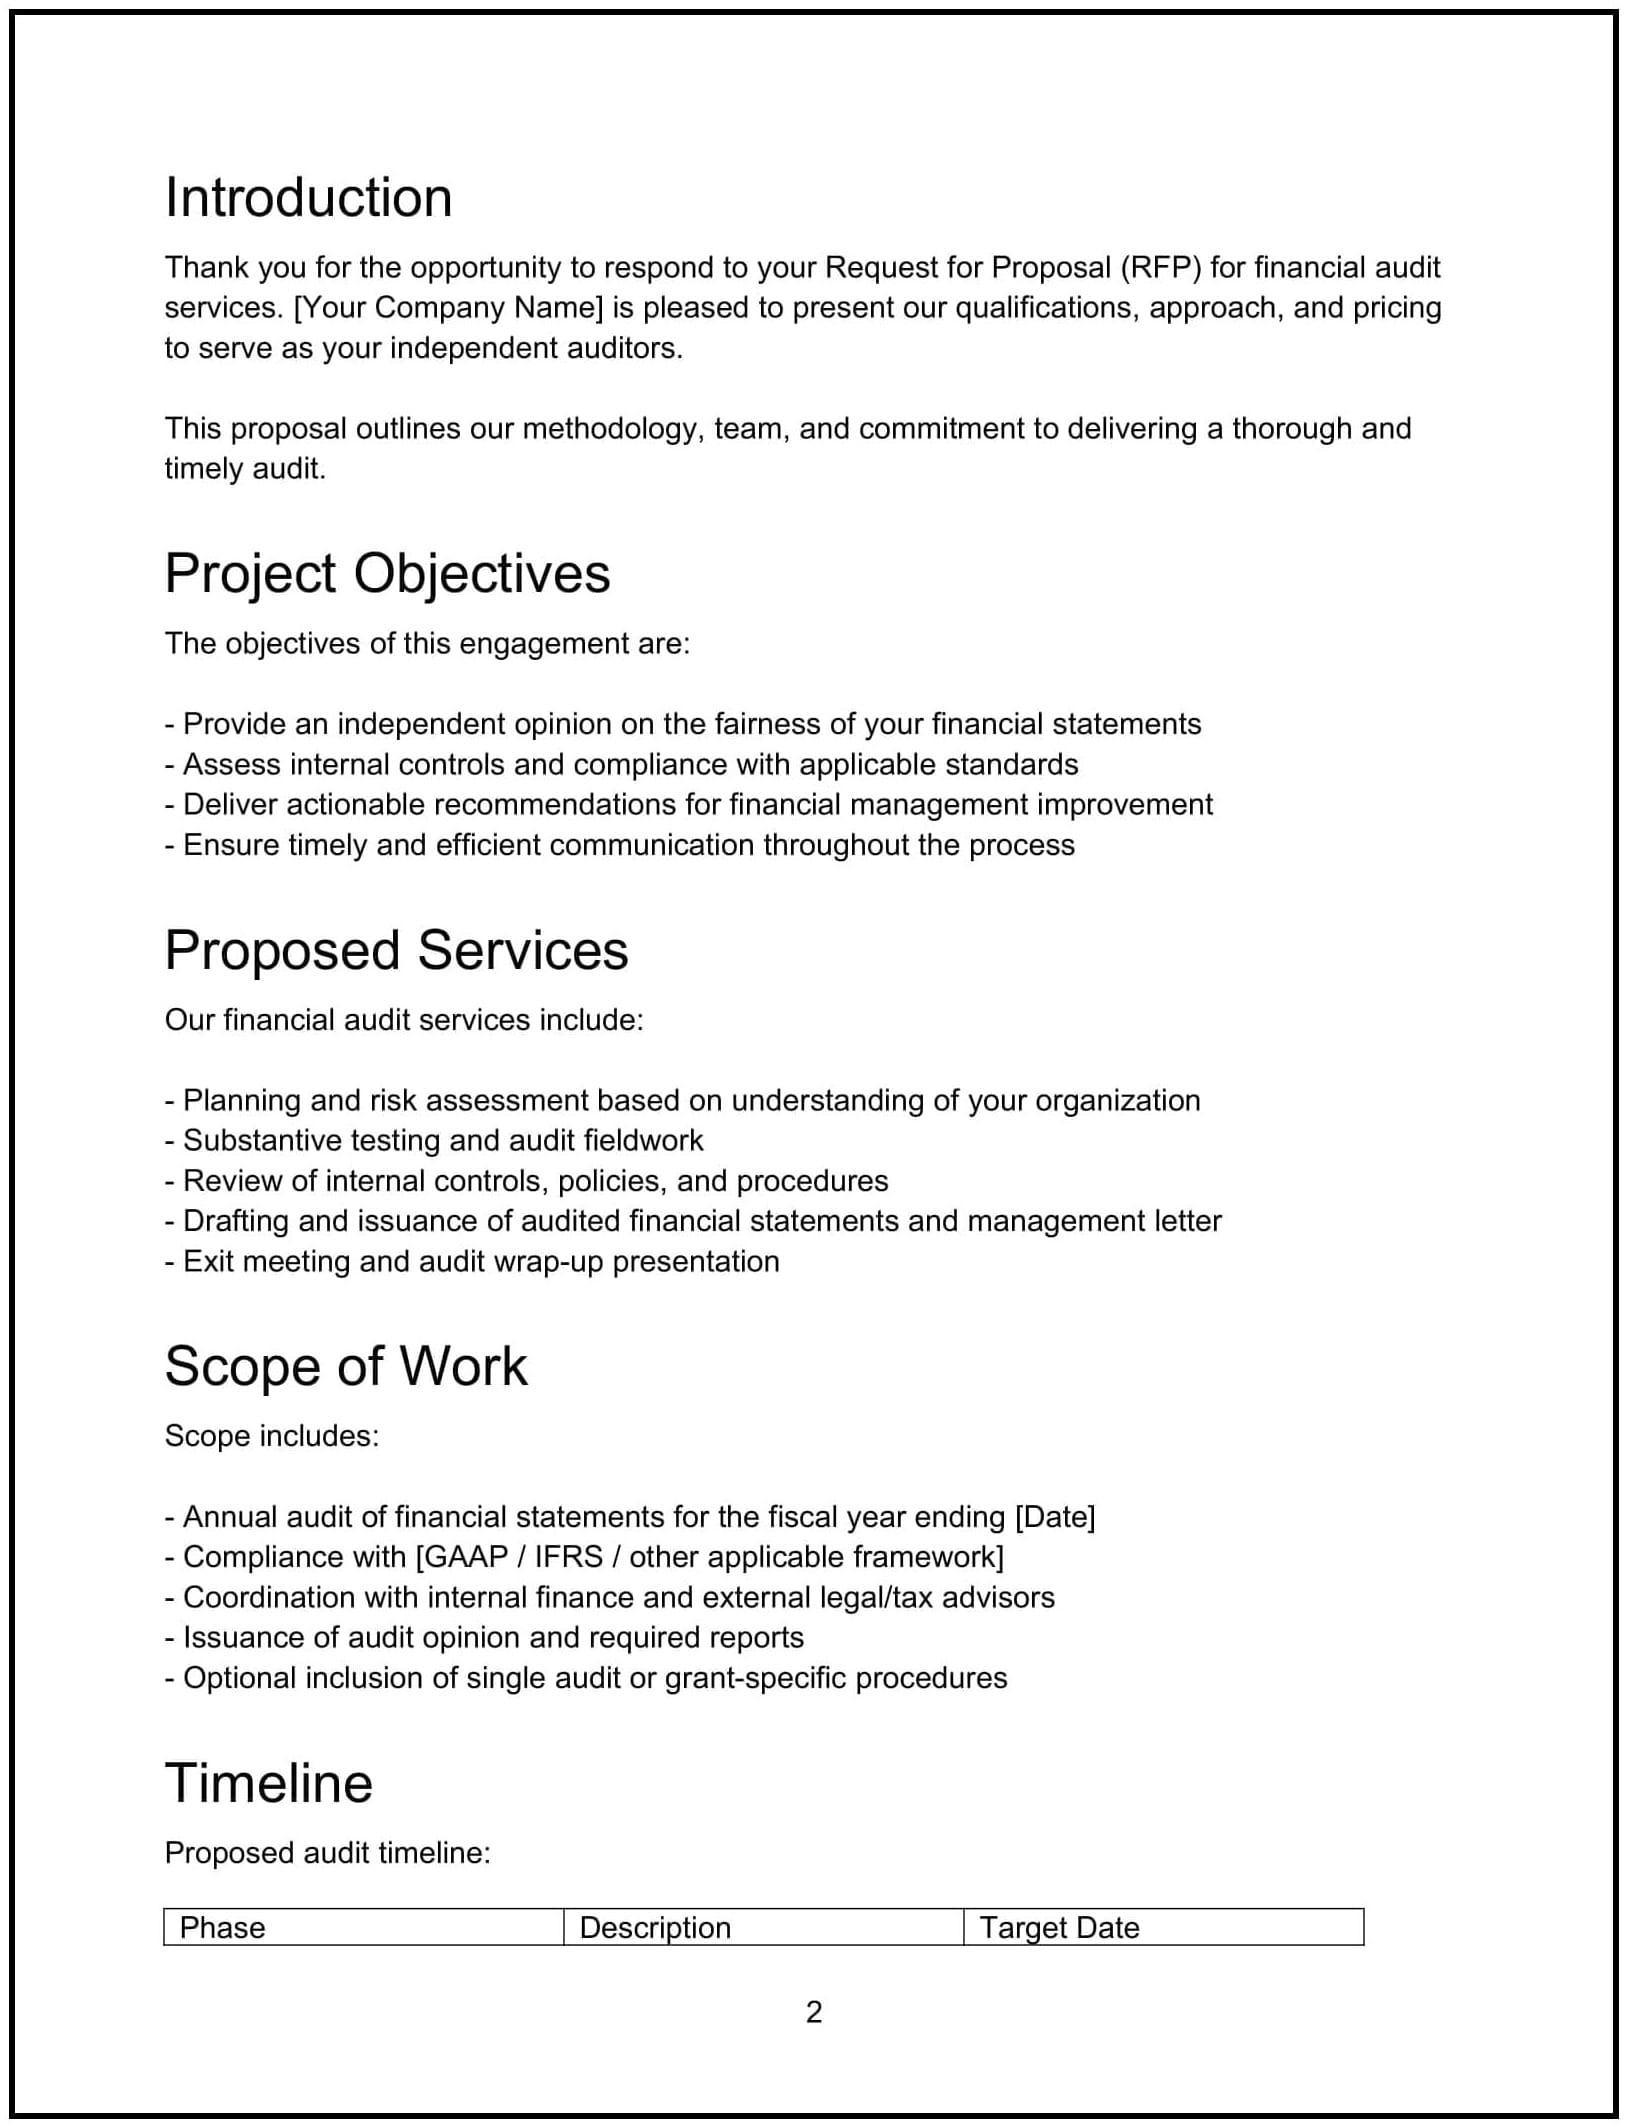
Proposes a response to a financial audit RFP, detailing audit methodology, team qualifications, compliance standards, timeline, and fee structure to demonstrate capability and win the engagement.
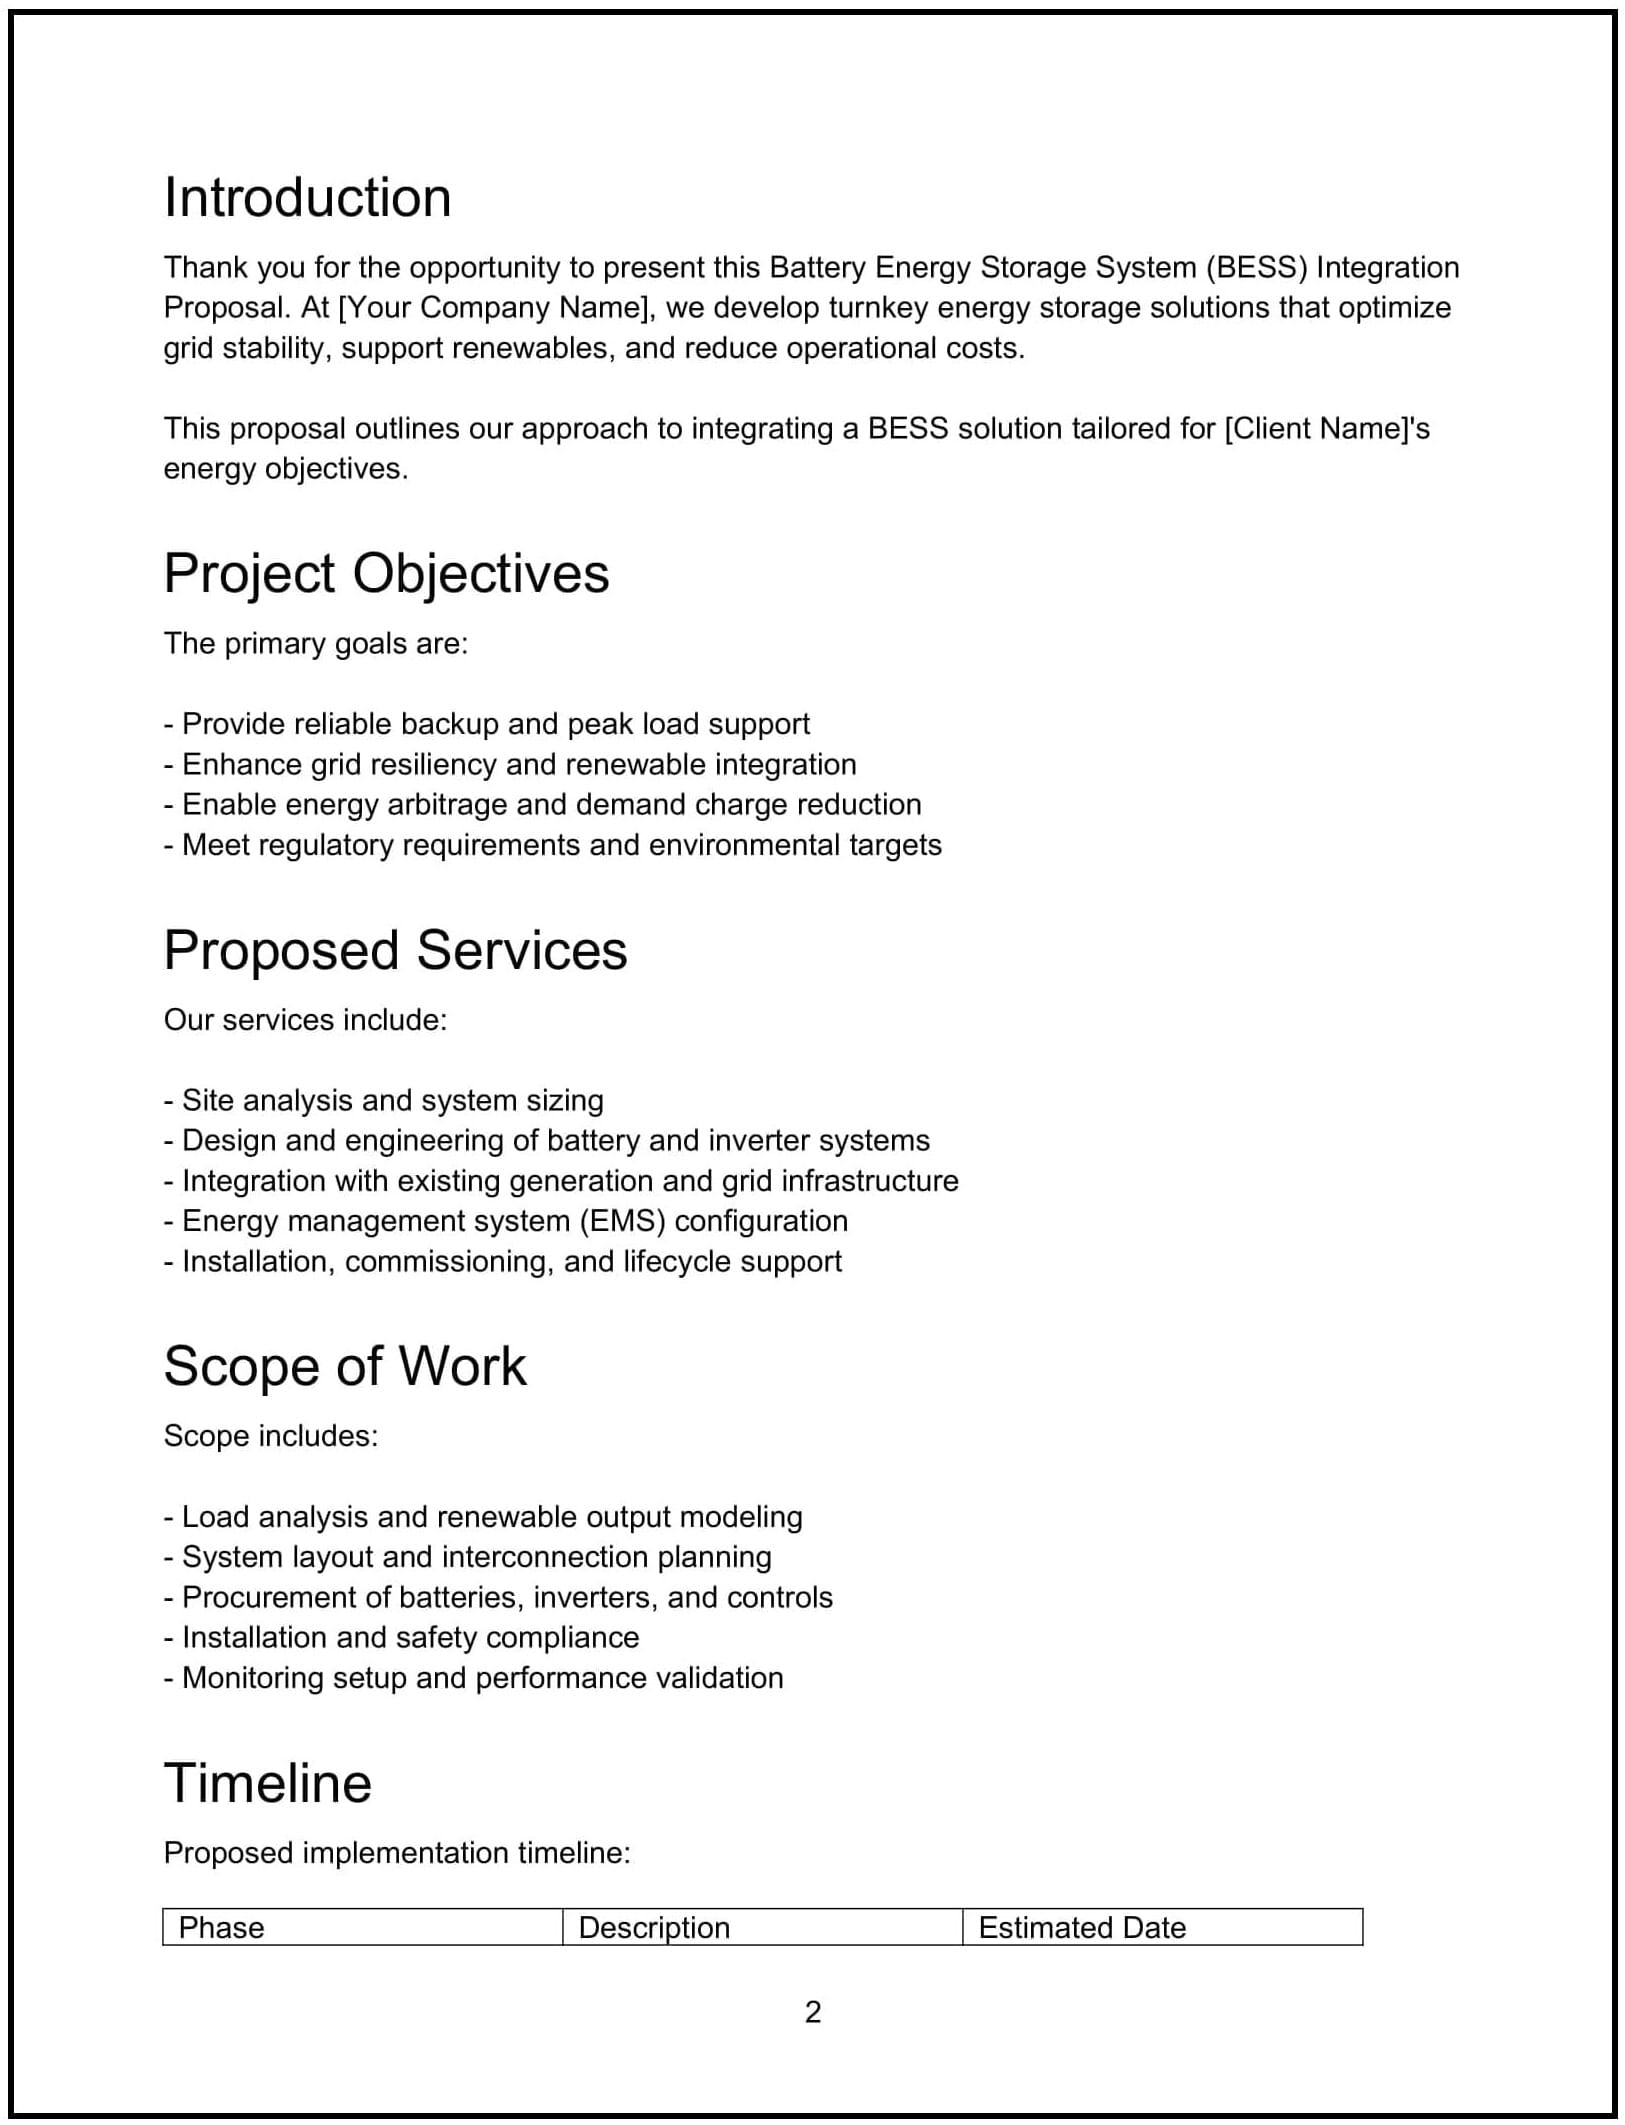
Proposes a battery energy storage system integration plan, detailing system design, load balancing, grid compatibility, and ROI analysis to enhance energy reliability and efficiency.
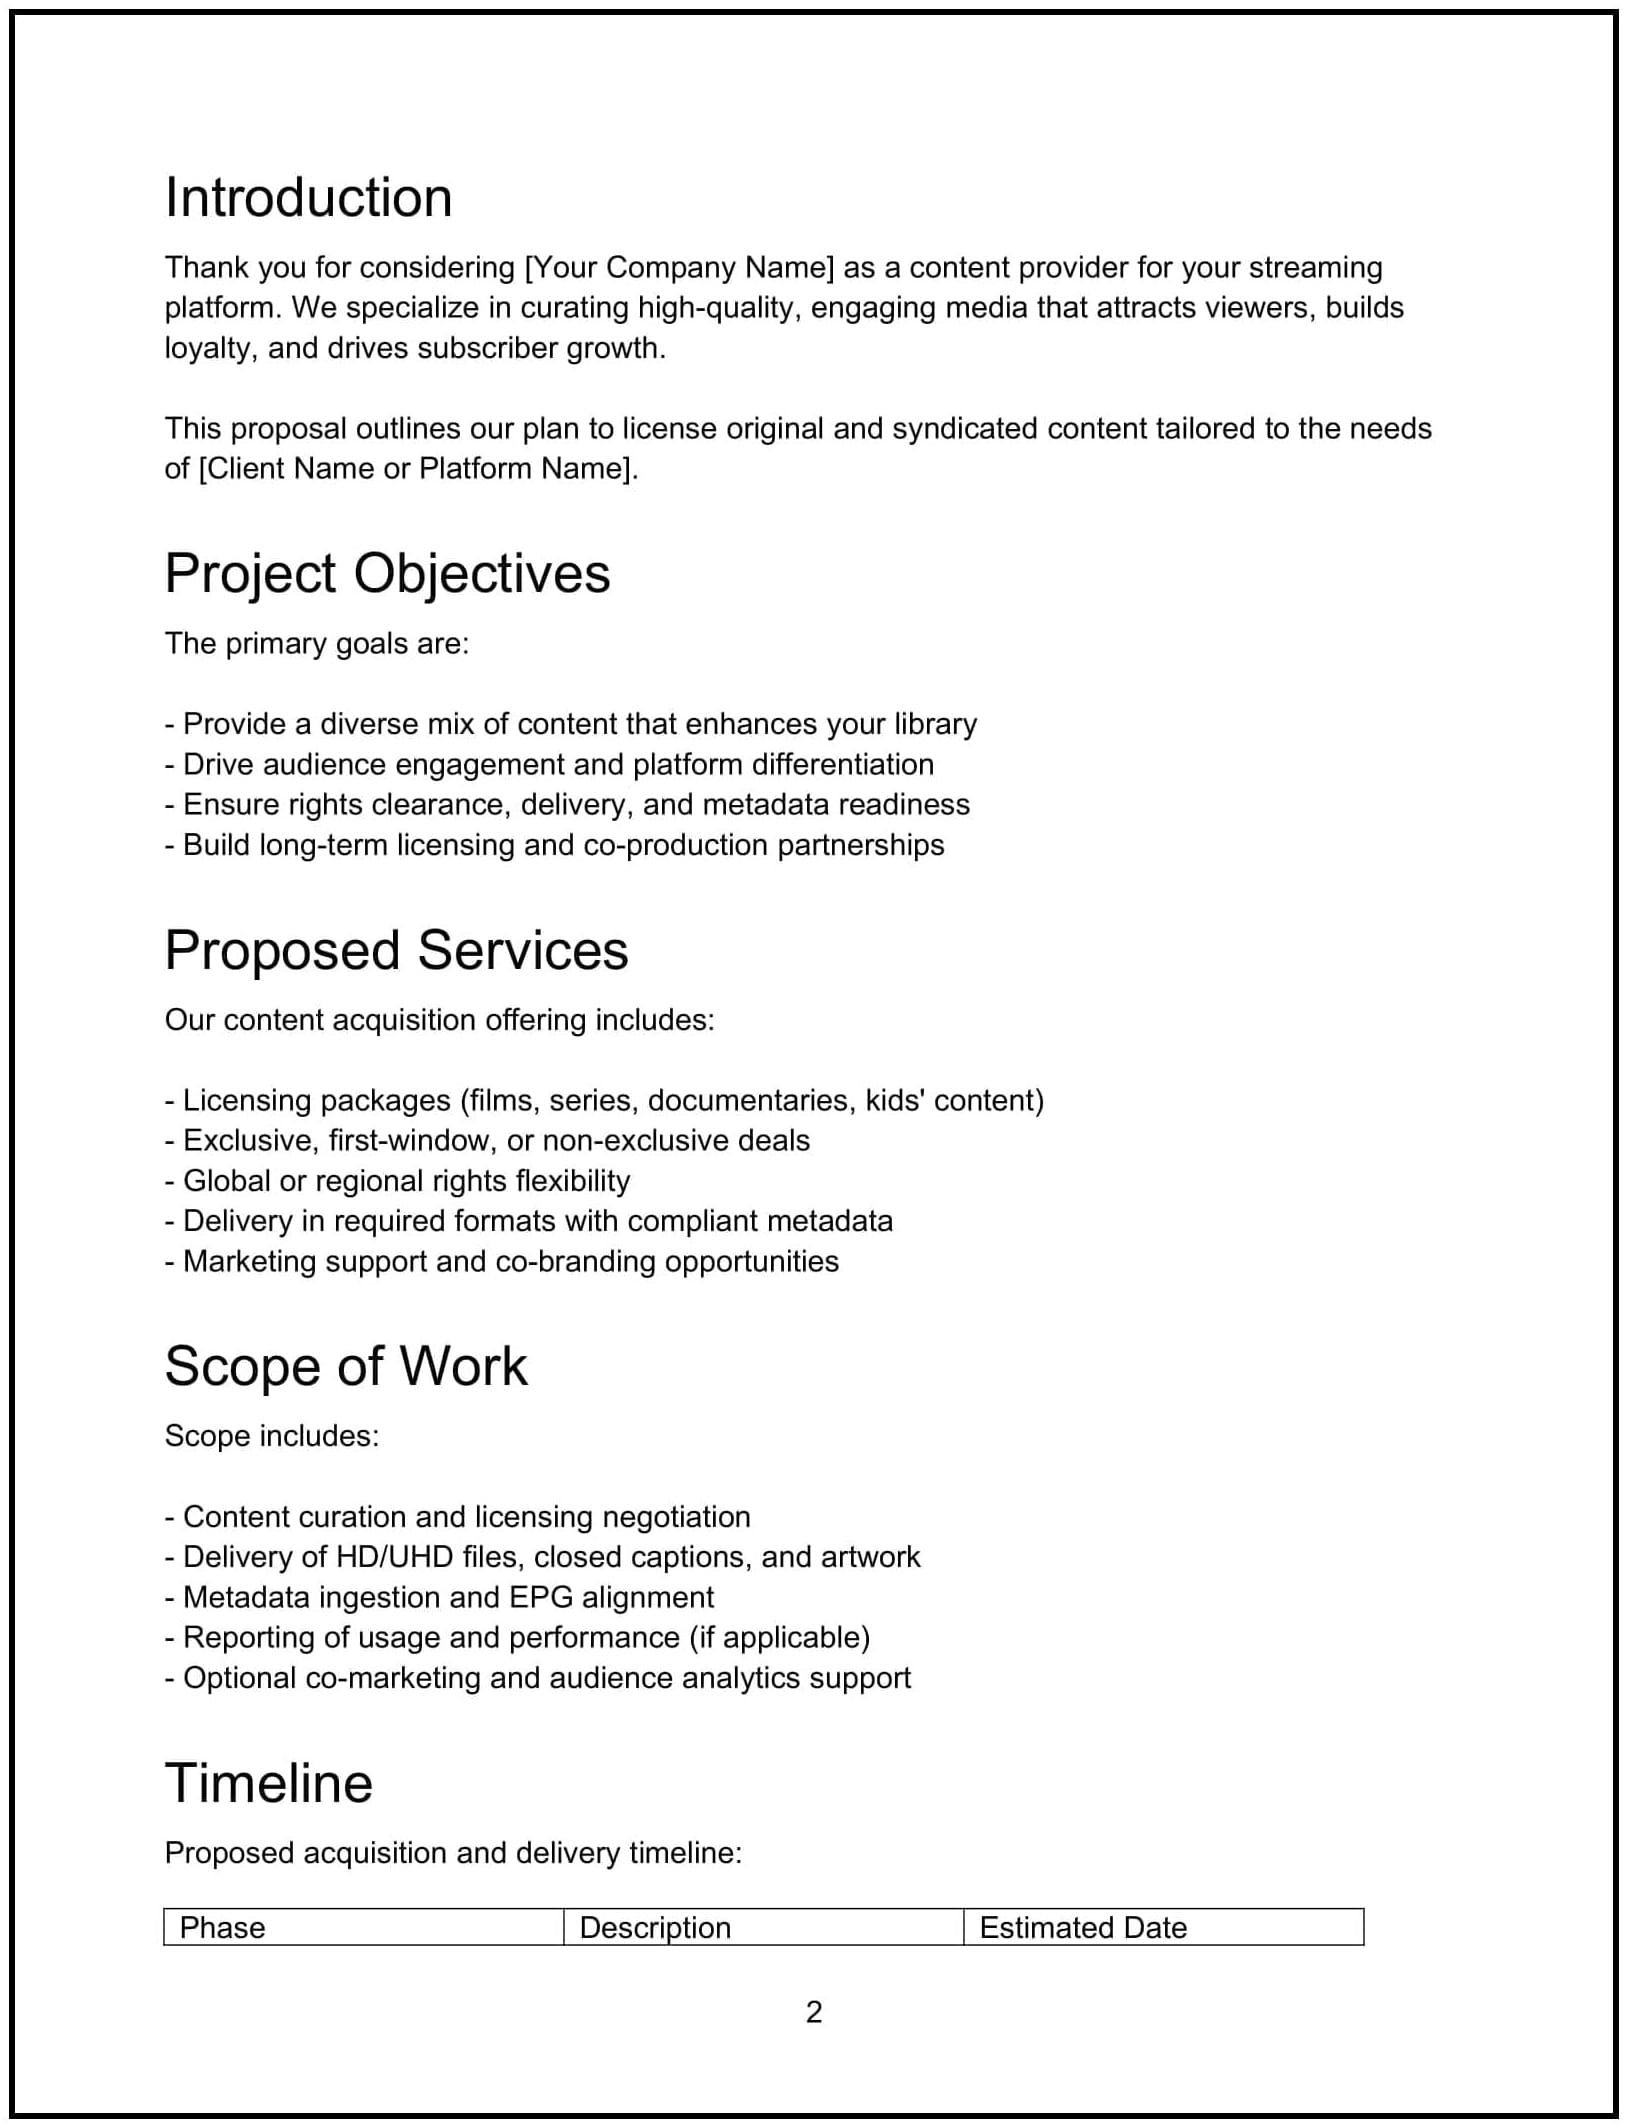
Proposes a streaming content acquisition plan, outlining content selection criteria, licensing terms, audience analysis, and ROI projections to enhance platform offerings and viewer engagement.